
雅思图表作文范文之以柱状图为例
- 2019年02月01日14:00 来源:小站整理
- 参与(0) 阅读(45513)
雅思图表作文范文之以柱状图为例为大家带来雅思小作文(图表作文)中柱状图这一类图形的范文和解析。雅思小作文在a类雅思考试中,都是图表类型的作文,要我们根据题干中给出的图表进行描述。通常要求我们写大于150个字。我们今天以其中一种常考的题型——柱状图为例,来展示小作文的范文。
上图来自网络
The chart below shows the amount of money per week spent on fast foods in Britain. The graph shows the trends in consumption of fast foods.
Write a report for a university lecturer describing the information shown below.
柱状图显示的是1970-1990二十年间英国人每周在快餐上花费了多少钱;曲线图展示的是这二十年间快餐消费的趋势。
The bar chart shows how much money was spent on fast foods per week in the UK over a span of 20 years from 1970 to 1990 while the graph reveals the trend of fast food consumption over the same period of time.
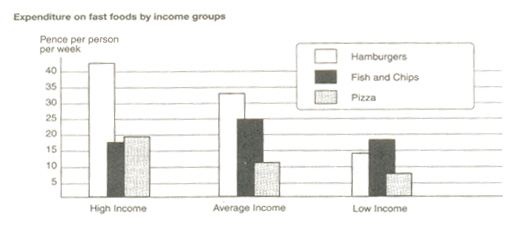
从柱状图看,各收入阶层在汉堡和鱼煎薯条这两种快餐上的支出相对高于在皮萨上的消费;曲线图反映出汉堡与皮萨的消费呈现上升趋势,鱼煎薯条则呈现出波动趋势。
As we can see from the chart, the weekly expenses of people of different income levels on hamburgers and fish and chips were relatively higher than that on pizza. The graph indicates that while hamburger and pizza consumption both revealed a general trend of increase, fish and chips showed a trend of fluctuation.
首先,高收入阶层和中等收入阶层每周在汉堡上的平均消费分别是每人42便士和33便士,比低收入阶层的14便士搞出了很多。在鱼煎薯条方面,高收入阶层的支出略低,是17便士,但中等及低收入阶层的支出都分别达到了25便士和18便士,相对于在皮萨方面支出的12便士和8便士高出了很多。值得一提的是高收入阶层在皮萨上的消费高于鱼煎薯条2便士,为20便士。
First, the weekly average expenses of high-income people and middle-income people were 42 pence and 33 pence respectively, a lot higher than that of low-income people which was 14 pence. As for fish and chips, high-income people spent relatively less, only 17 pence, but the expenses of middle-income and low-income groups reached 25 pence and 18 pence, much higher than their expenses on pizza which stood at 12 pence and 8 pence respectively. What is worth mentioning is the amount of money spent on pizza by high-income people which showed only 20 pence, 2 pence more than their expense on fish and chips.

第二,从1970年的每周平均85克开始,人们在汉堡上的消费缓步增长到了1975年的100克,然后,消费量加大增速,到1983年左右已经达到了200多克。接下来,我们看到的是更强势的增长,到1990年达到了图表上的最高峰550克。
Second, starting from averagely 85 grams per week in 1970, people’s consumption of hamburgers gradually grew to 100 grams in 1975 and was then followed by a faster growth, reaching more than 200 grams in around 1983. From then on, the growth gained a stronger momentum, hitting the peak across the board at 550 grams in 1990.
第三,皮萨的消费趋势与汉堡相仿,也是很明显的三个增长阶段,但是增幅没有汉堡那么大。1970年至1980年,皮萨的消费从平均每周40克慢慢增长到80克;1980年至1985年,增长加快,从80克增加到了130克;1985年至1990年,增幅加大,从130克快速增长到了280克。
Third, the consumption of pizza revealed a similar trend of growth as that of hamburgers and could also be clearly cut into three periods, though the growth rate was not that fast. It rose slowly from 40 grams per week in 1970 to 80 grams in 1980 and then grew faster from 80 grams in 1980 to 130 grams in 1985. From 1985, the growth rate was even faster and we see a big increase from 130 grams to 280 grams.
第四,鱼煎薯条的消费趋势在波动中呈现了三种状态。1970年至1975年一直是缓慢的下降,从平均每周300克降至280克;之后,从1975年至1985年,下降速度稍有加快,从280克降至200克;自此,开始逐渐回升,到1990年攀升到了240克。
Fourth, the consumption of fish and chips showed three changes in the general trend of fluctuation. From 1970 to 1975, it dropped slowly from the original 300 grams per week in 1970 to 280 grams in 1975. Later on, from 1975 to 1985, it dropped a little bit faster when it fell from 280 grams to 200 grams. From then on, it began to rise gradually and till 1990, it had climbed back to 240 grams.
总之,英国人在上述所提及的三种快餐方面的消费在图表所标识的二十年里都发生了或增或降的某些变化。
To sum up, the consumption of the three above mentioned fast foods in Britain showed certain rises and falls as illustrated in the chart and graph over the designated 20 years.

以上就是雅思图表作文范文之以柱状图为例的全部内容,我们可以看出文中举例的范文着重描写数据的量和变化。这是在描写柱状图这种图形时的要点。上文采取典型的英文作文的形式——总分总来叙述题中给出的柱状图的信息。我们可以参照他的这种格式,也可以着重看一下他在描述数量和走势时有用哪些词语。
更多雅思资讯请关注小站雅思。


 that you like")
")

")


